FAQ › How much do I need to invest?
Summary: There is no strict minimal investment, as we do not directly manage your funds. You retain full control over your investment decisions and portfolio management while you replicate our model portfolios in your own account. However, we recommend a minimal investment of $5,000 (or €) to ensure an accurate replication of our model portfolios.
Our model portfolios consist of 3 to 5 different ETFs, and their allocation size changes over time as our algorithm detects systematic performance shifts in different asset classes. Since most brokers do not allow to trade fractional ETF shares outside of saving plans, small investors may not be able to closely follow the recommended allocation sizes. For example, one share of SPY currently costs about $600, so to accurately attain a 20% exposure to SPY, the minimum investment would be $3,000. Below, we explore in detail how the performance of our Basic Portfolio depends on the initial investment capital.
First, we take a closer look at our most popular model portfolio, the Basic Portfolio, which invests in 5 different ETFs that cover stocks, bonds, gold, and other commodities. To investigate the effect that the initial capital has on the performance of the Basic Portfolio, we run several backtests with varying initial capital, starting at $2,500 up to $1,000,000 (for the US version, and analogous for the Euro-denoted EU version). We assume realistic trading costs of 0.1% of the trading volume as spread costs, and a $5 (or €5) flat fee for each trade (this is rather conservative, as many brokers offer lower fees or even no-fee trading for popular ETFs). We then evaluate the performance of all simulations with respect to 4 metrics:
In the chart panel below, you see the equity curves of the US version of the Basic Portfolio starting with the different initial capitals ($2.5k in dark gray, to $1M in light gray) alongside the equity curve of just buying and holding SPY as a benchmark (red). The subsequent panels then show the performance metrics for the different initial capital values (gray dots) alongside the SPY benchmark metrics (red line):
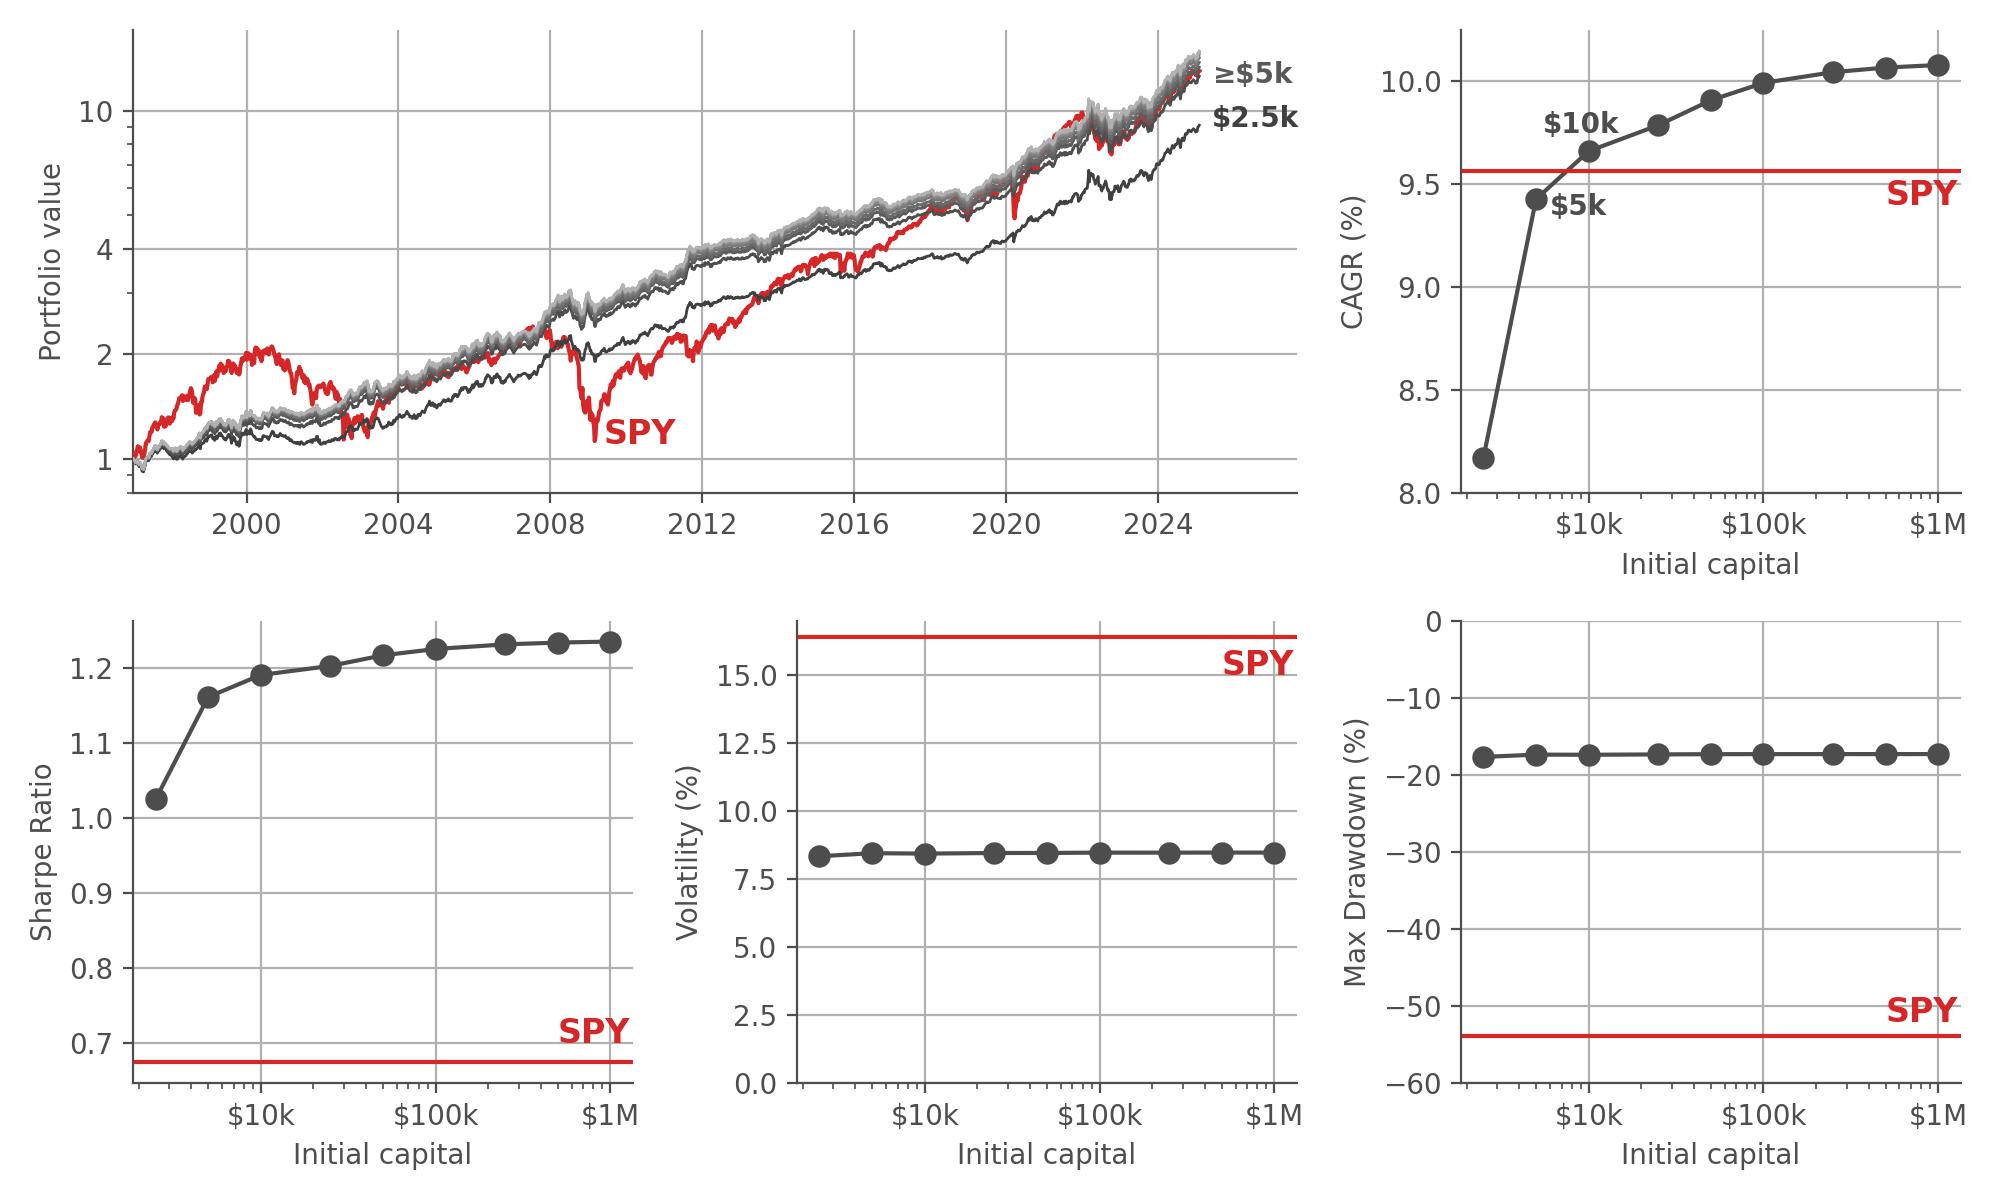
As we can see, the CAGR does improve as we assume larger and larger initial capital values, simply because a flat brokerage fee becomes increasingly negligible for larger trades, and because we can more accurately replicate the exact allocation weights for each ETF in larger portfolios because rounding effects for the shares to buy become less important (e.g. it makes a large difference whether to buy 1 or 2 shares, but it does not make such a large difference whether to buy 50 or 51 shares). We find that investing only $2.5k results in a quite substantially lower CAGR, whereas starting your investment with $5k or more replicates the CAGR of SPY benchmark closely or even surpasses it. Remember, the goal of the Basic Portfolio is not to beat the SPY as a benchmark, its aim is to provide about the same return as SPY, but with only half the risk. Looking at the Sharpe Ratio makes us optimistic that we have reached this goal, as the risk-adjusted return is significantly higher for any amount of initial capital invested in the Basic Portfolio, compared to the benchmark. Finally, looking at both volatility and maximum drawdown, we can see that the Basic Portfolio fulfills its promise of running at about half the risk of the benchmark.
The EU version of the Basic Portfolio trades the UCITS-regulated equivalents of the ETFs traded in the US version. It is important to note that most of these ETFs trade US-Dollar denominated products (e.g. US stocks and bonds), and due to the changing value of the US-Dollar with respect to the Euro, the equity curves will look a bit different. Below, we repeat the same simulations as above, but using the EU-version of our Basic Portfolio. Note that the simulations start slightly later than the US version, because the Euro as a currency was only introduced in financial markets in 1999.
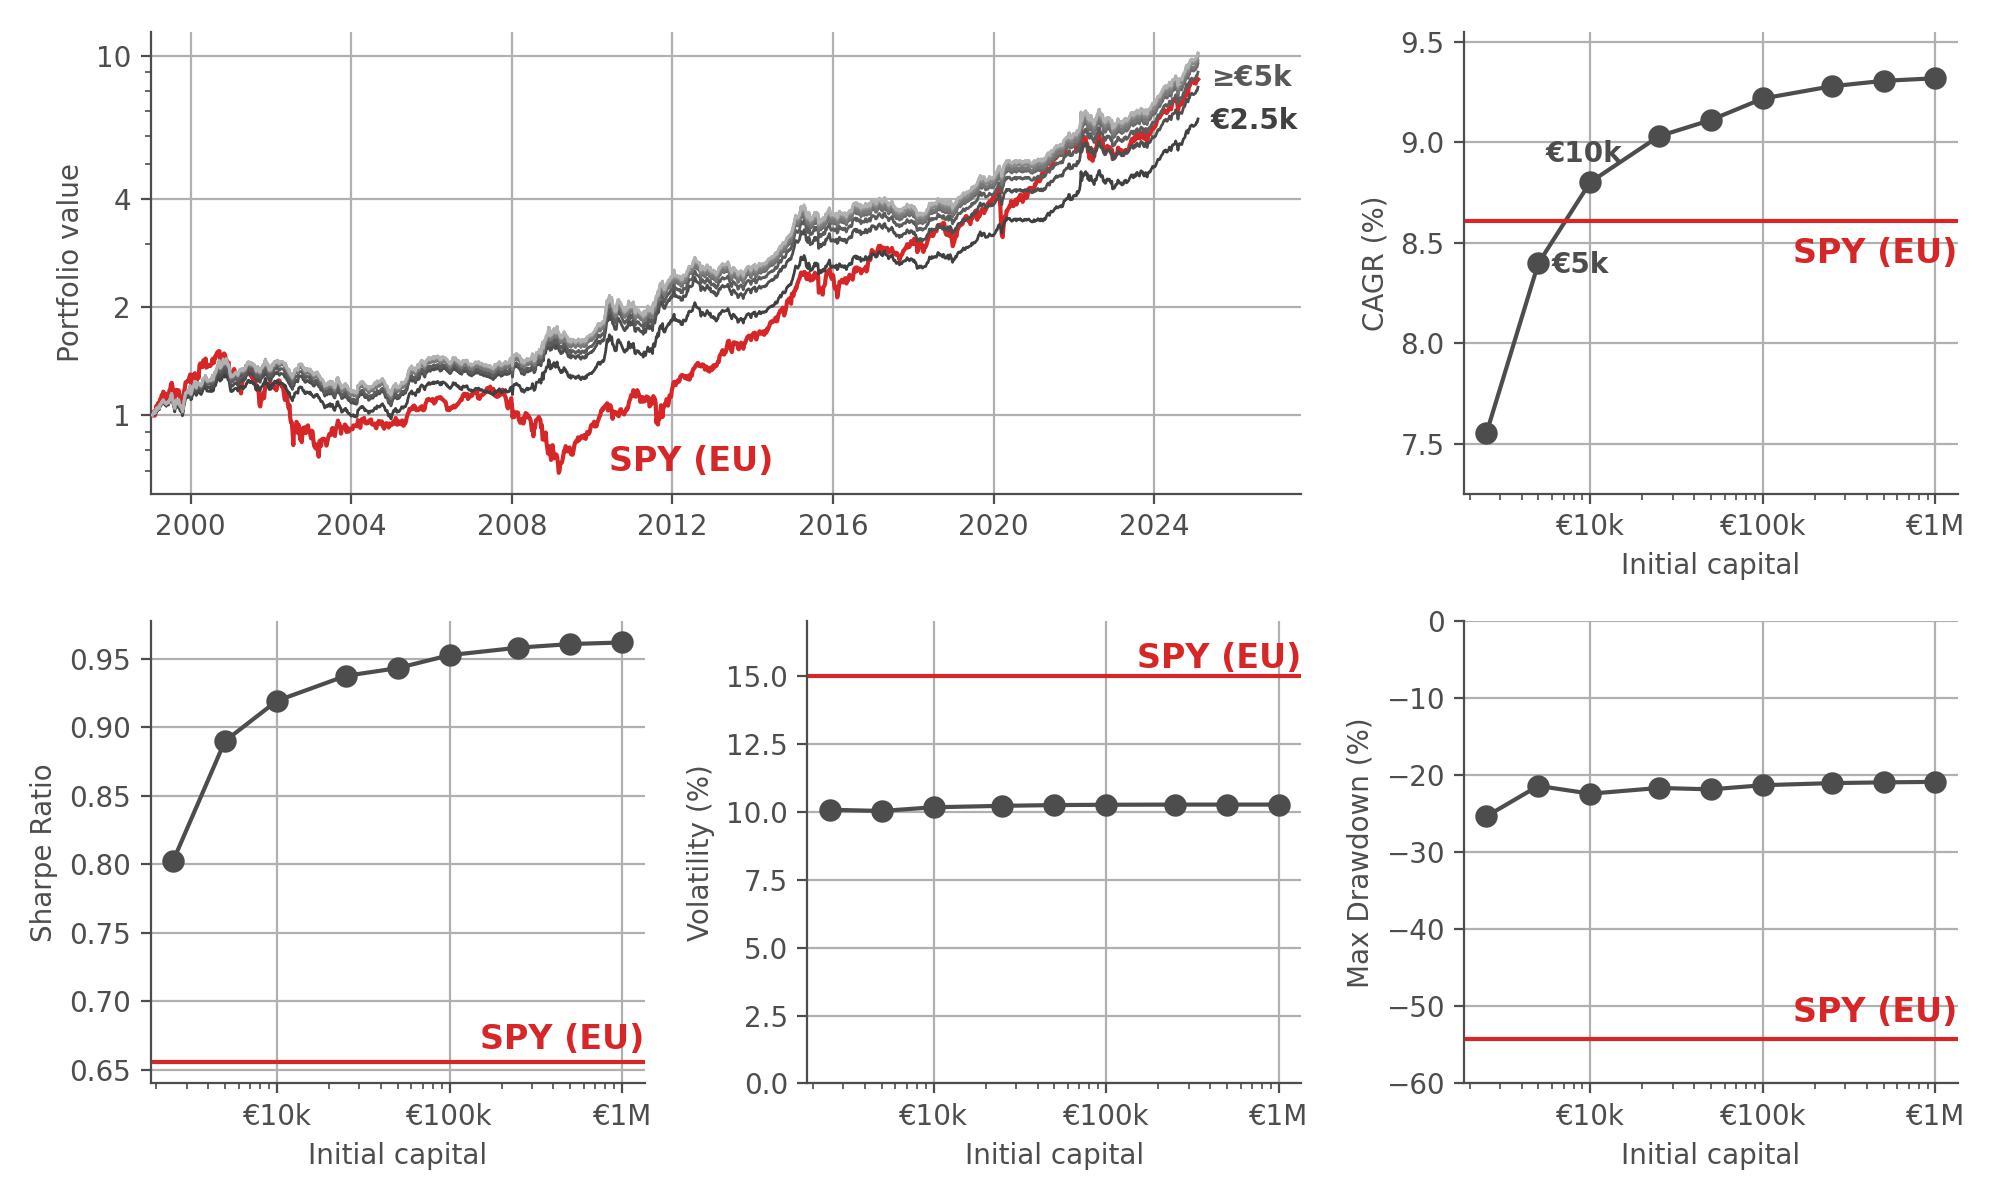
As we can see, performance metrics for the EU version are slightly inferior to those of the US version of the Basic Portfolio due to the US Dollar appreciating in value compared to the Euro over the time of the simulation. However, the key findings remain the same: by investing €5k or more, you will replicate the performance of SPY (denoted in Euro), and further benefit from enhanced risk metrics.
Next, we take a closer look at our Pro Portfolio, which invests in 3 different leveraged ETFs that cover stocks, bonds, gold. This model portfolio aims to outperform the S&P 500 by entering diversified but leveraged positions in different asset classes. To investigate the effect that the initial capital has on the performance of the Pro Portfolio, we again run several backtests with varying initial capital, starting at $2,500 up to $1,000,000 (for the US version, and analogous for the Euro-denoted EU version). We assume realistic trading costs of 0.1% of the trading volume as spread costs, and a $5 (or €5) flat fee for each trade (this is rather conservative, as many brokers offer no-fee trading for popular ETFs). We then evaluate the performance just like we did for the Basic Portfolio above.
In the chart panel below, you see the equity curves of the US version of the Pro Portfolio starting with the different initial capitals ($2.5k in dark gray, to $1M in light gray) alongside the equity curve of just buying and holding SPY as a benchmark (red). The subsequent panels then show the performance metrics for the different initial capital values (gray dots) alongside the SPY benchmark metrics (red line):
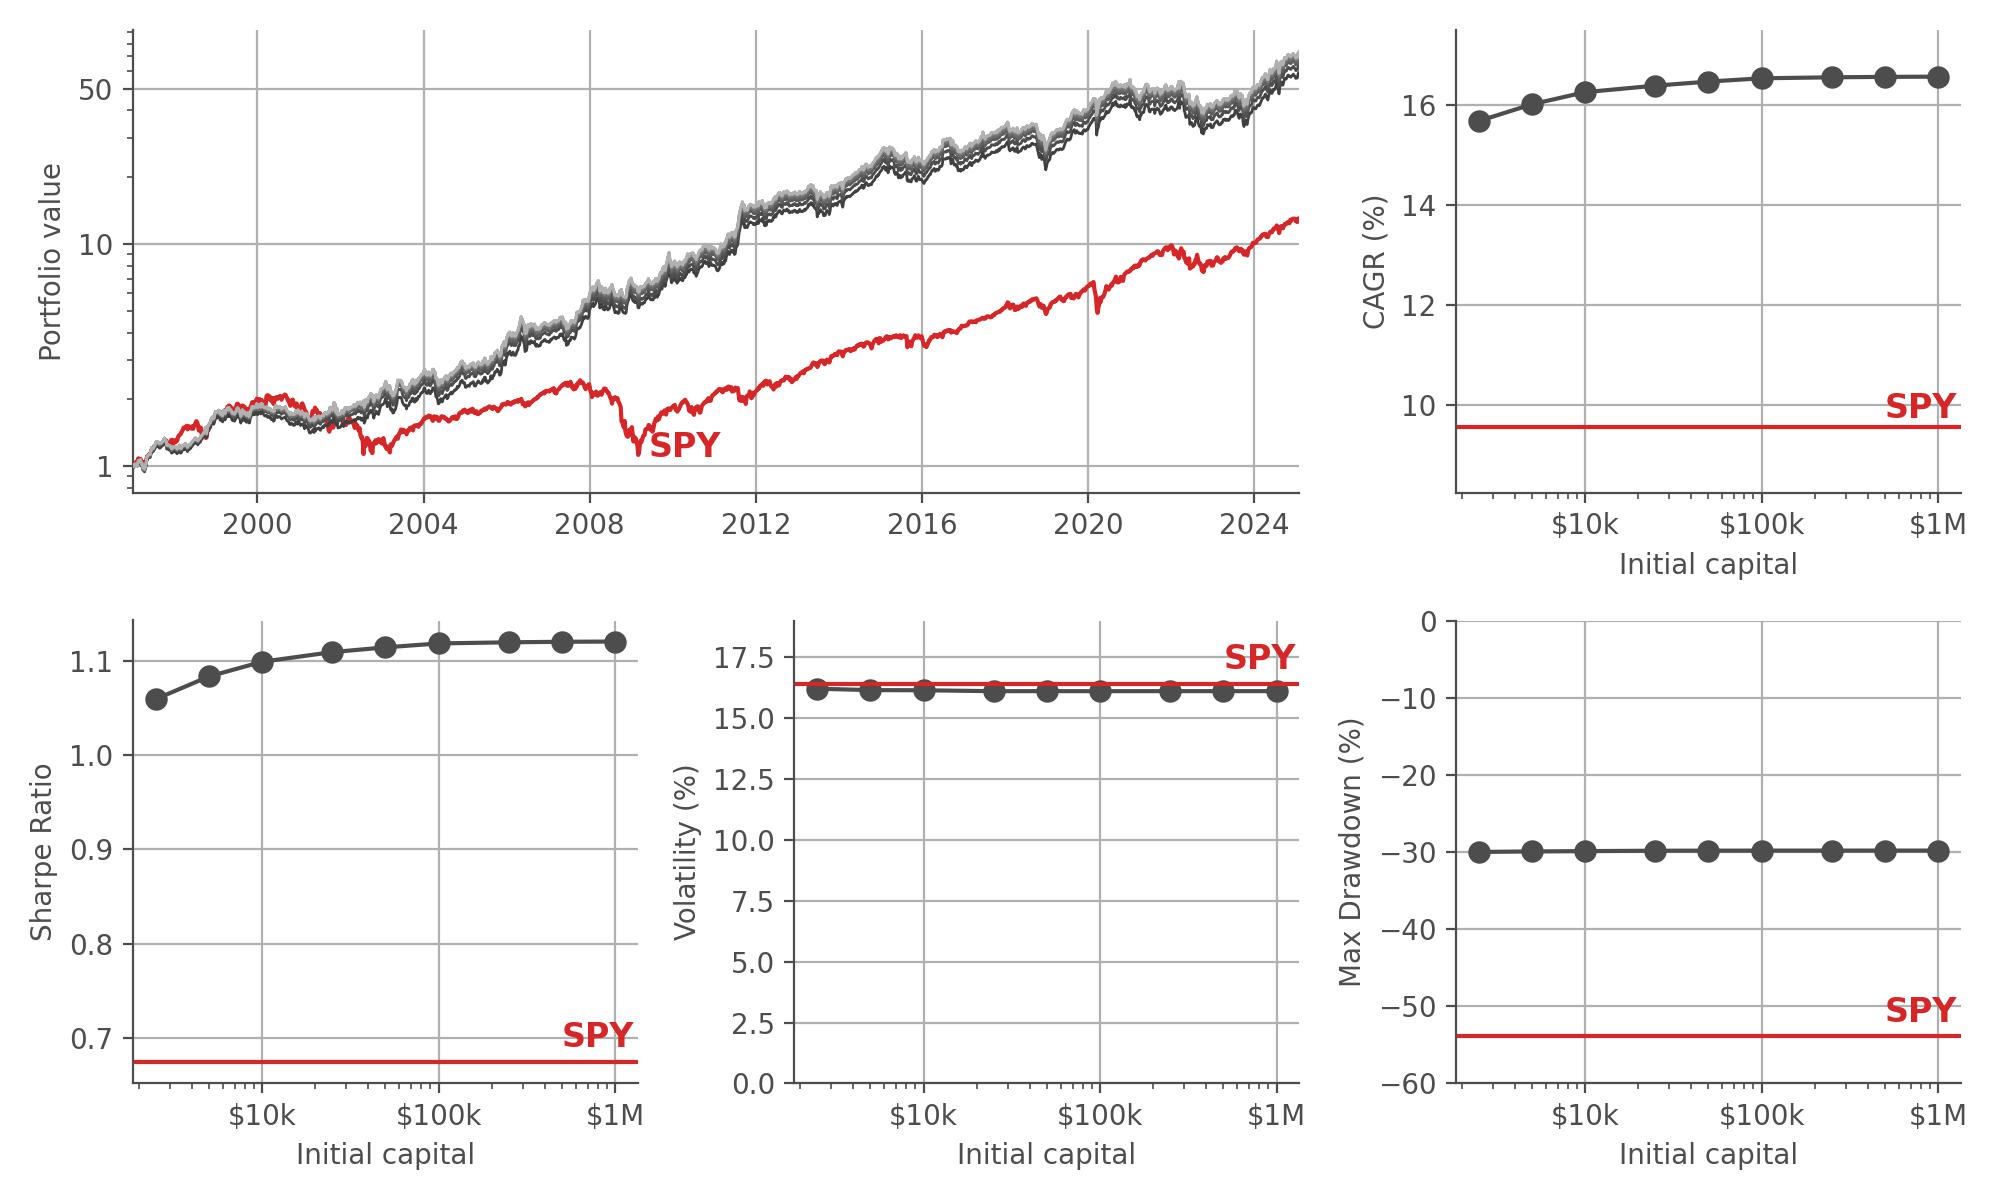
At first sight, these statistics seem to indicate that the performance of the Pro Portfolio is much less dependent on the initial capital. However, keep in mind that this is only true on a long time horizon: since the Pro Portfolio features a larger CAGR, the invested capital grows further over time, such that share discretization effects become less important over long time periods.
The EU version of the Pro Portfolio trades the UCITS-regulated equivalents of the ETFs traded in the US version. It is important to note that most of these ETFs trade US-Dollar denominated products, and due to the changing value of the US-Dollar with respect to the Euro, the equity curves will look a bit different. Below, we repeat the same simulations as above, but using the EU-version of our Basic Portfolio. Again, simulations start slightly later than the US version, because the Euro as a currency was only introduced in financial markets in 1999.
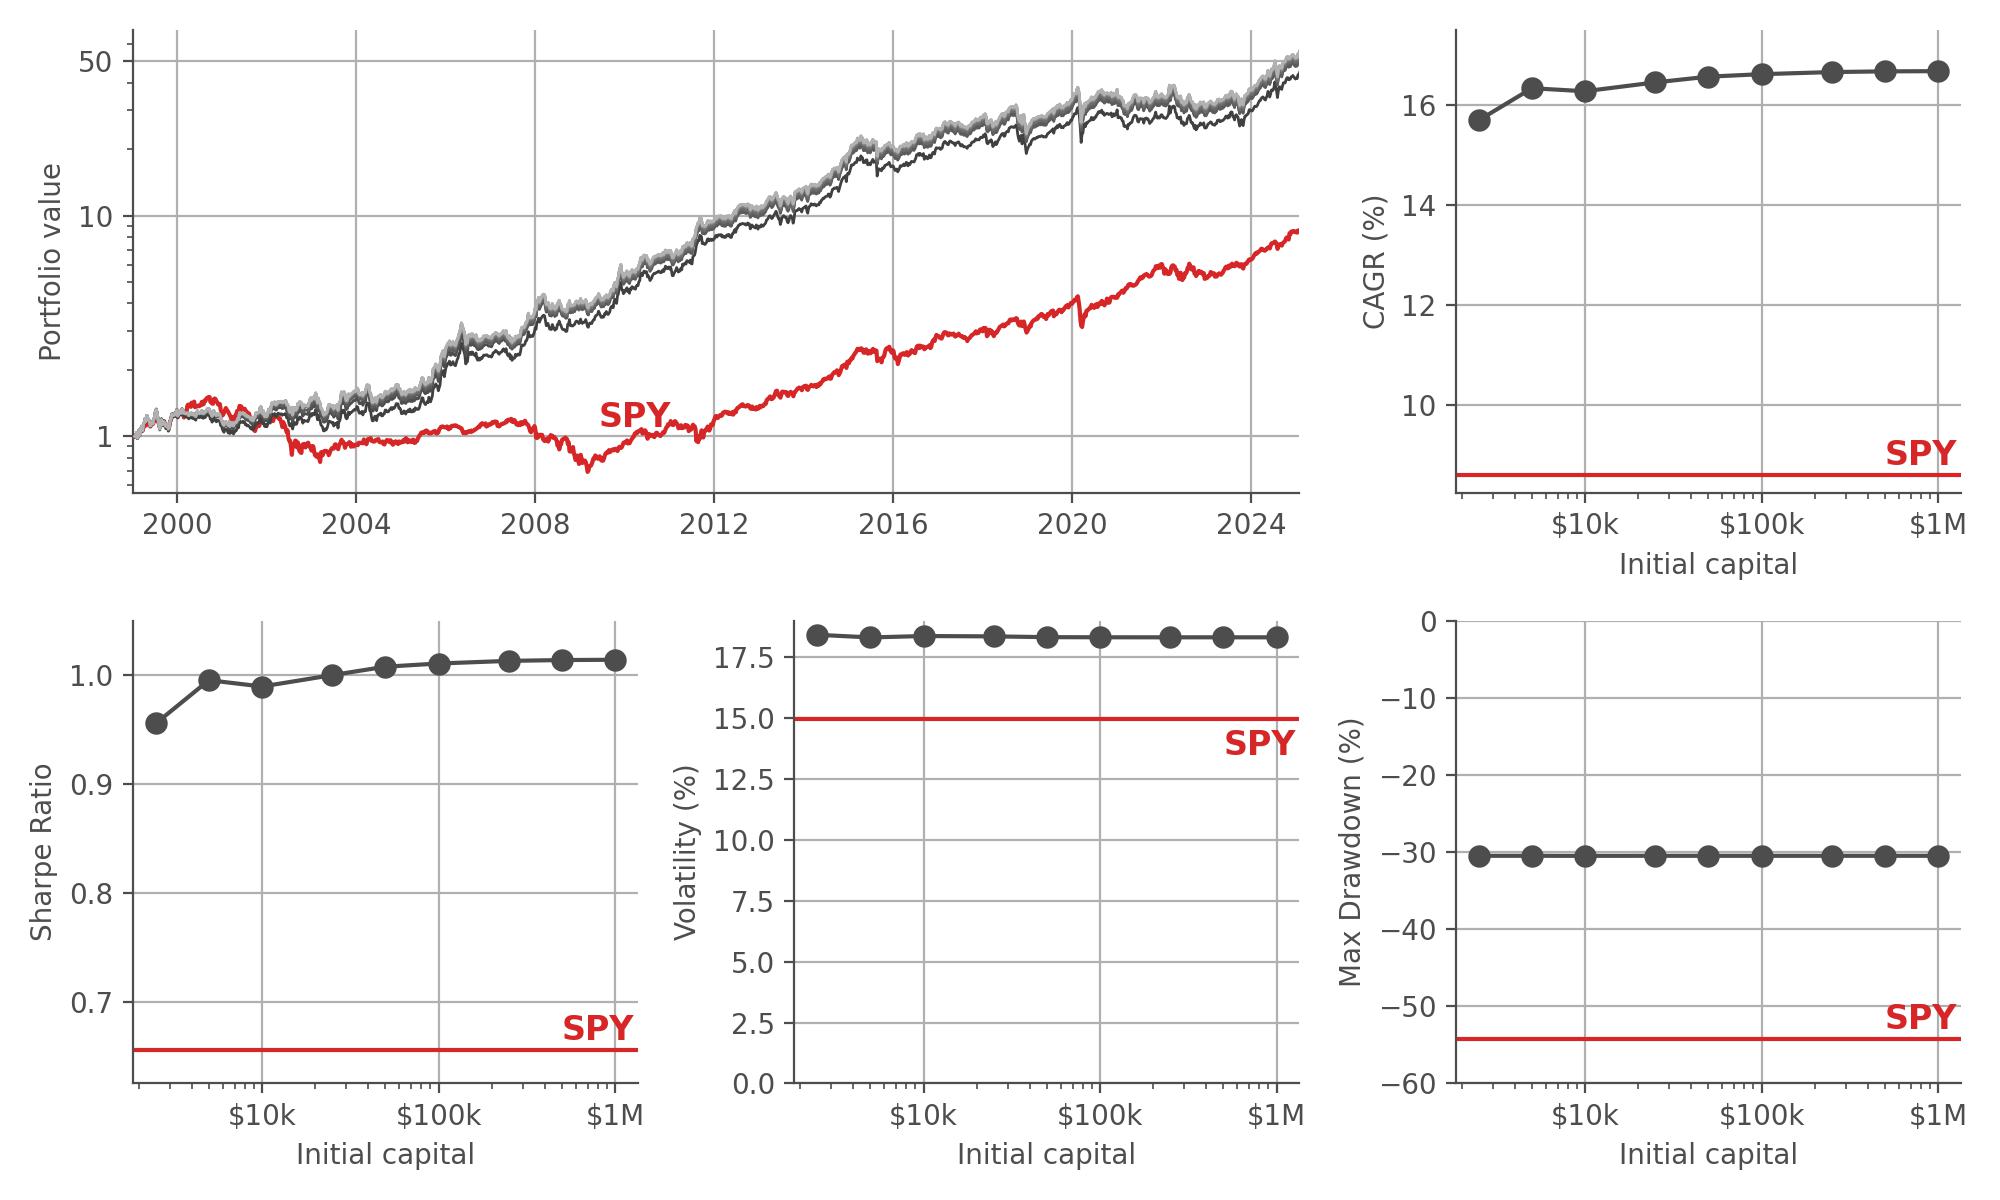
While the EU version of the Pro Portfolio almost exactly replicates the CAGR of the US version, the volatility is slightly higher, while the maximum drawdown is still superior to the S&P 500 benchmark. As for the US version, we note that the Pro Portfolio seems to be much less dependent on the initial capital compared to the Basic Portfolio, but this is only true for long investment periods. As the Pro Portfolio features a larger CAGR, the invested capital grows further over time, such that share discretization effects become less important over long time periods.