FAQ › How do taxes affect portfolio performance?
Summary: Our model portfolios work best when implemented in retirement accounts or special savings accounts (such as Roth IRA accounts in the U.S.) that benefit from deferred tax payments or even allow tax-free withdrawals. When capital gains tax is applied to every trade directly, the growth rate of our model portfolios decreases depending on the tax rate, but the model portfolios still retain their superior risk metrics compared to buying and holding stock indices.
Our model portfolios are actively traded portfolios that rotate capital between different ETFs to adjust to changing market dynamics. This regular buying and selling of ETFs may incur capital gains tax, depending on the type of account you use and on your local tax legislation. Some countries offers special retirement accounts (such as Roth IRA accounts in the U.S., or Canada's Tax-Free Savings Account) that benefit from deferred tax payments or even allow tax-free withdrawals. If such an account is available to you, you can copy trade our model portfolios without additional tax burden due to portfolio adjustments. In countries that do not offer such special accounts, we have to consider the additional tax cost of portfolio adjustment when comparing the performance of our model portfolios to benchmarks such as buying and holding the SPY. Even when buying and holding SPY, you will have to pay capital gains tax when you eventually sell your shares. But for actively traded portfolios like our model portfolios, the situation is a bit different: because capital gains tax is usually collected directly at trade time, the paid taxes are no longer available for compounding returns, which reduces the overall growth rate of the portfolio more than in the buy-and-hold case.
To get a better overview on the magnitude of this effect, we run simulations of our model portfolios, assuming different tax rates, from zero tax rate up to 30% capital gains tax.
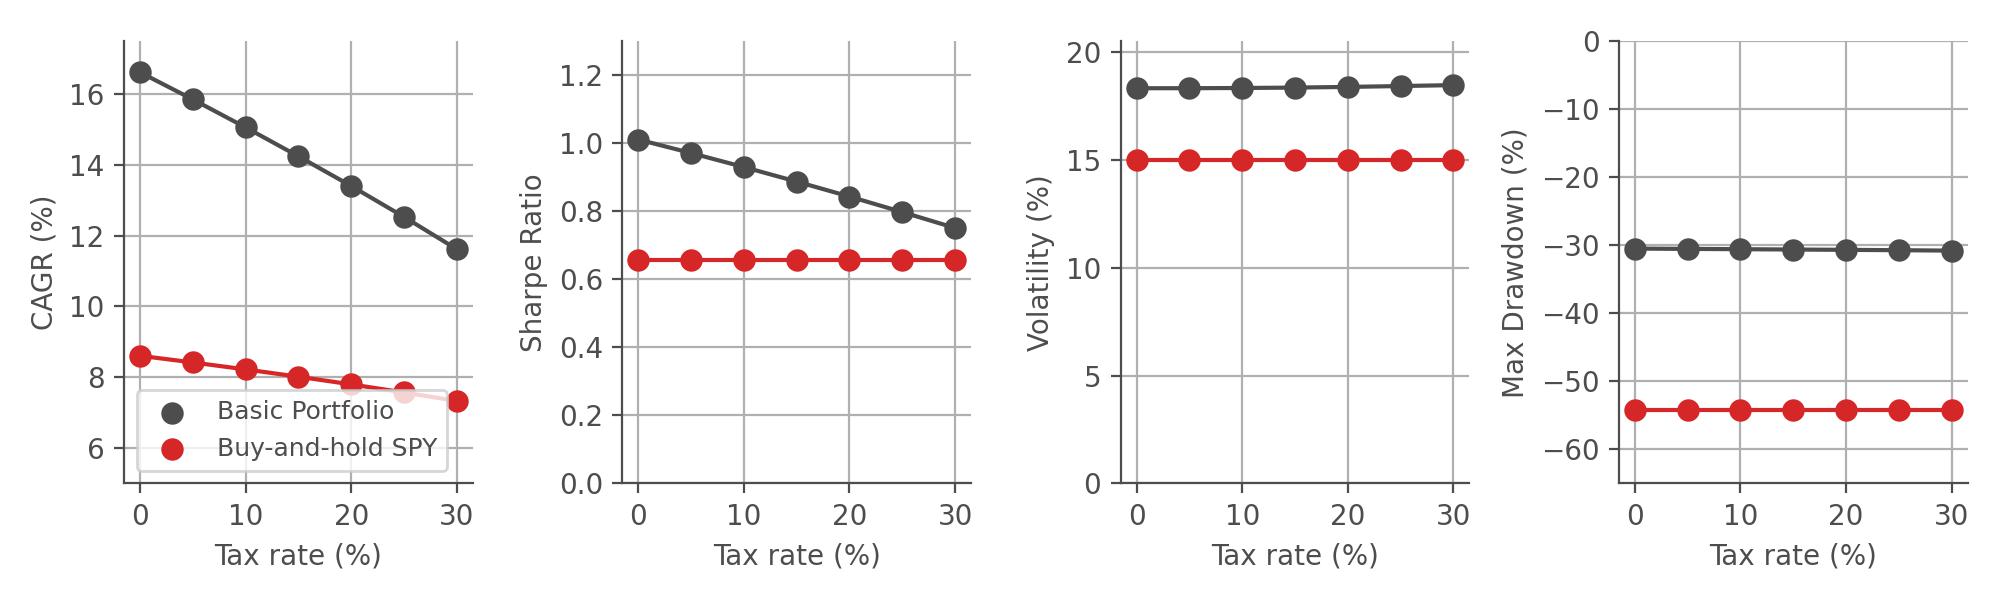
First, we take a closer look at the US version of our most popular model portfolio, the Basic Portfolio, which invests in 5 different ETFs that cover stocks, bonds, gold, and other commodities. We assume that we start investing in 1997 with monthly portfolio adjustments, and we further assume typical costs of trading, specifically a brokerage fee of $5 per trade and 0.1% spread cost. As a benchmark, we simulate buying and holding the SPY, an ETF that tracks the S&P 500 index. For non-zero tax rates, we assume that we completely sell our portfolio at the end of the investment period (this also applies to the buy-and-hold benchmark). In the graphs below, we evaluate the performance of the Basic Portfolio for different tax rates with respect to 4 metrics:
As we can see, the growth rate (CAGR) of our portfolio decreases almost linearly with an increasing tax rate. However, due to the active trading in our Basic Portfolio, its growth rate decreases faster with an increasing tax rate compared to the buy-and-hold strategy that only pays taxes at the very end of the investment period. However, we can see that for all assumed tax rates up to 30%, the risk-adjusted return (measured by the Sharpe Ratio) as well as the portfolio risk (measured by volatility and maximum drawdown) of the Basic Portfolio is superior to the buy-and-hold SPY strategy. This nicely illustrates that even at high tay rates and without special retirement accounts, the Basic Portfolio provides ample benefits for investors!
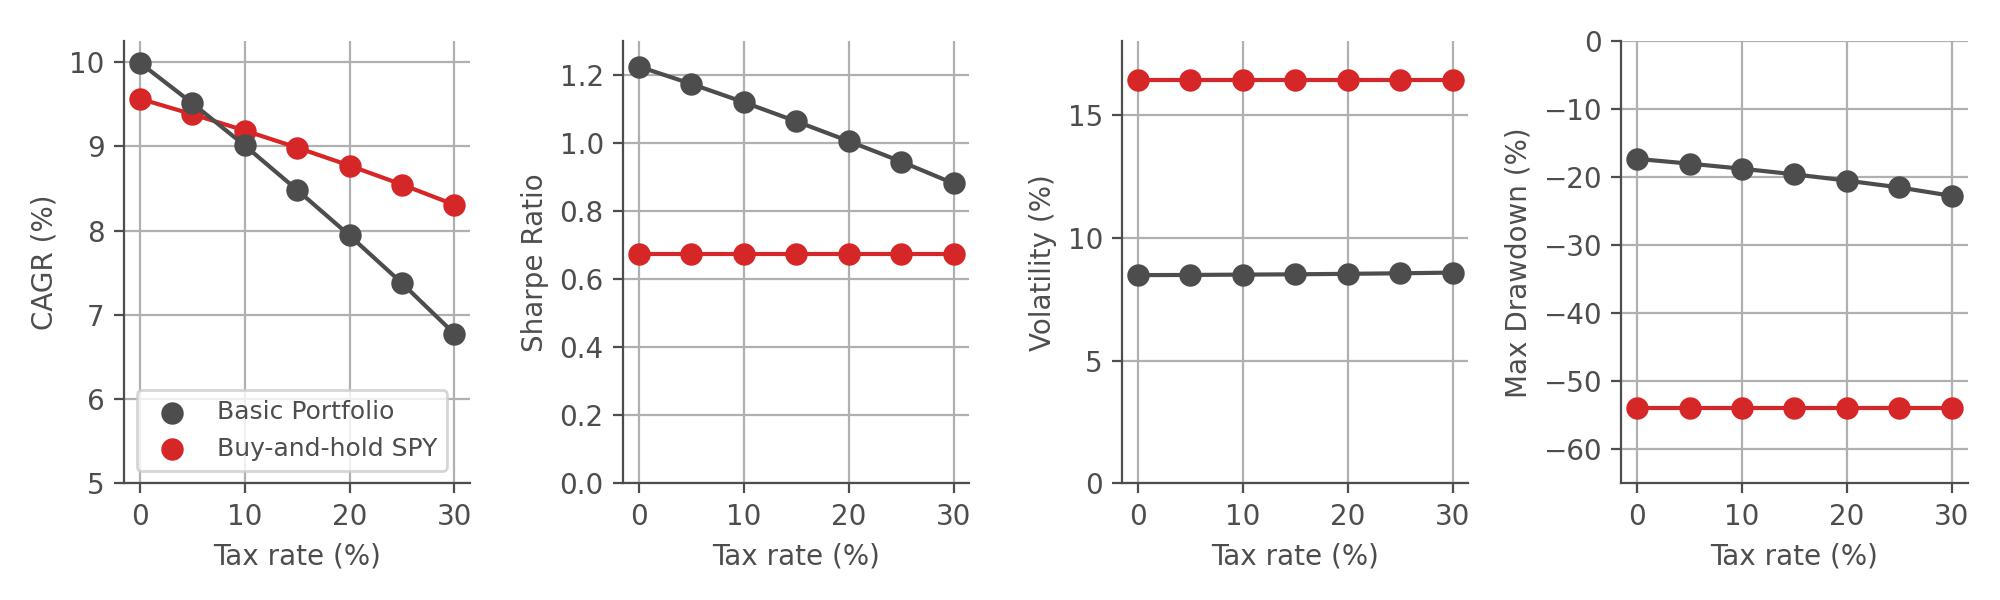
The EU version of the Basic Portfolio trades the UCITS-regulated equivalents of the ETFs traded in the US version. It is important to note that most of these ETFs trade US-Dollar denominated products, and due to the changing value of the US-Dollar with respect to the Euro, the equity curves will look a bit different. Below, we repeat the same simulations as above, but using the EU-version of our Basic Portfolio. Note that the simulations start slightly later than the US version, because the Euro as a currency was only introduced in financial markets in 1999.
While the exact metrics of the EU version differ slightly from the US version, due to the reasons mentioned above, the general conclusions remain the same.
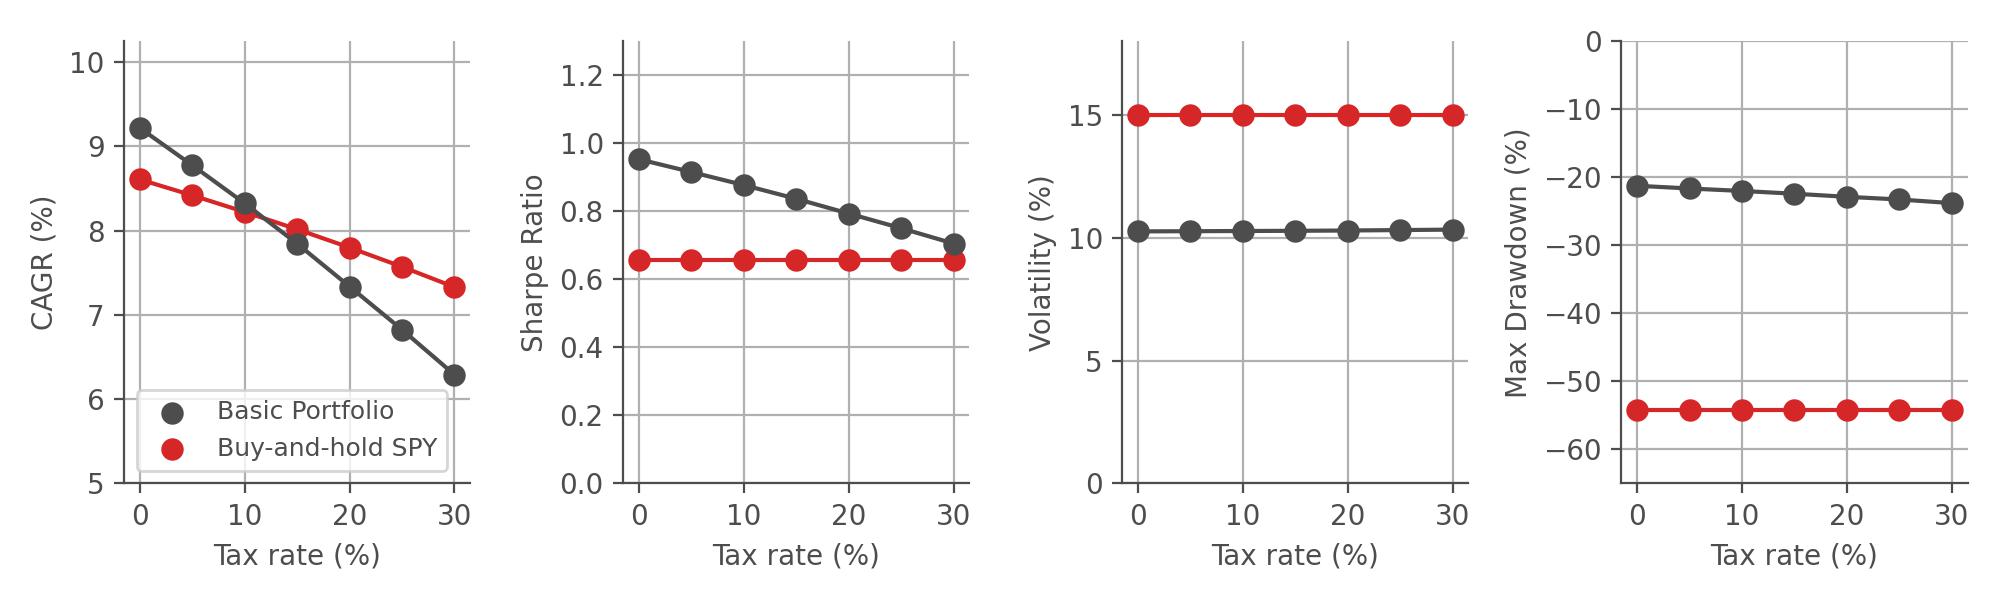
Next, we take a closer look at the US version of our Pro Portfolio, which invests in 3 different leveraged ETFs that cover stocks, bonds, gold. This model portfolio aims to outperform the S&P 500 by entering diversified but leveraged positions in different asset classes. Again, we assume that we start investing in 1997 with monthly portfolio adjustments, and we further assume typical costs of trading, specifically a brokerage fee of $5 per trade and 0.1% spread cost. As a benchmark, we simulate buying and holding the SPY, an ETF that tracks the S&P 500 index.
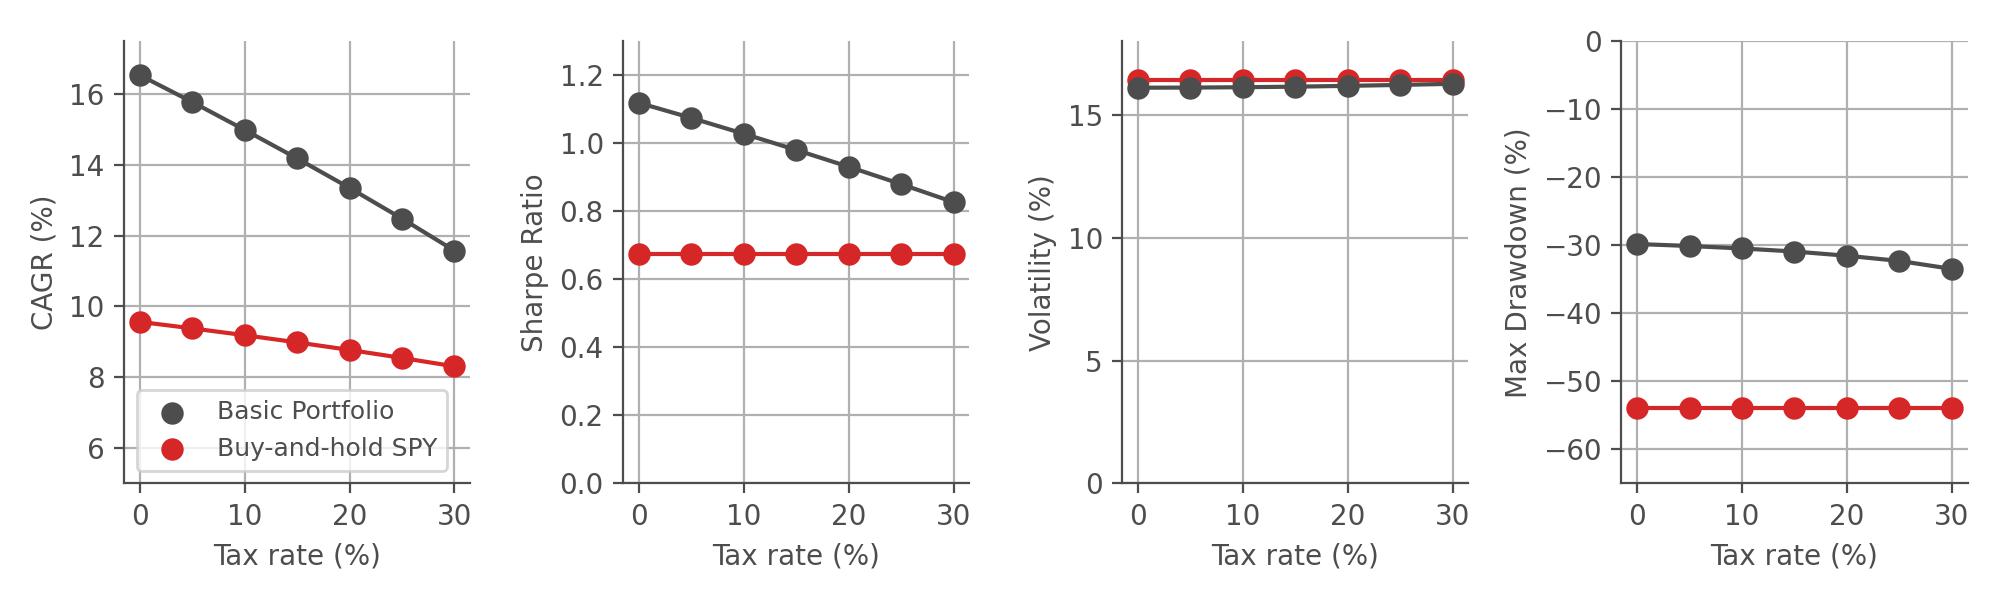
As we can see, the Pro Portfolio remains superior to the buy-and-hold S&P 500 benchmark for all tax rates up to 30%. This superiority is achieved by combining dynamic diversification/concentration via our Bayesian algorithm and by increasing the growth rate of our underlying assets via leveraged ETFs. Again the EU version of the Pro Portfolio behaves very similar: